The default settings should be ok to get you started. This information is provided for use once you're familiar with the basic setup of RouterStats.
Select the Graphs Tab.
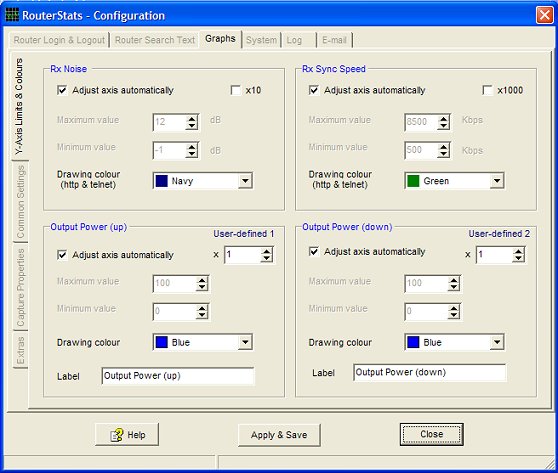
Here you can set the maximum and minimum values for the vertical (Y) axis of the Rx Noise, Rx Sync Speed and the two user-defined graphs. Alternatively, they can be configured to adjust automatically by checking the appropriate Adjust axis automatically checkbox.
If set to automatic, the graphs will initially start with the values set in the up/down edit boxes.
(It's debatable whether the scaling factor should be x1000 or x1024 -- As long as it lets the value fit the graph, it probably doesn't matter.)
Some routers (TP-Link TD-W8960N) apparently have a bug whereby the Noise Margin figures are displayed with values multiplied by a factor of 10. (6.5 dB will be displayed as 65 dB, for example). Check the x10 checkbox in the Rx Noise section so that RouterStats plots the values correctly.
For added flexibility, the User-defined graphs have a variable scaling factor instead of a checkbox.
For the ST585 and Netgear DG834-series of routers, the scaling for the Noise Margin and Sync Speed isn't required and the checkboxes have no effect.
The y-axes of the Tx Noise and Tx Sync graphs will adjust automatically when the measured value approaches the top of the graph. The adjusted maximum and minimum values will be 20% above and 20% below the measured value. Hopefully, this keeps the range of the axes within a sensible proportion of the value being measured.
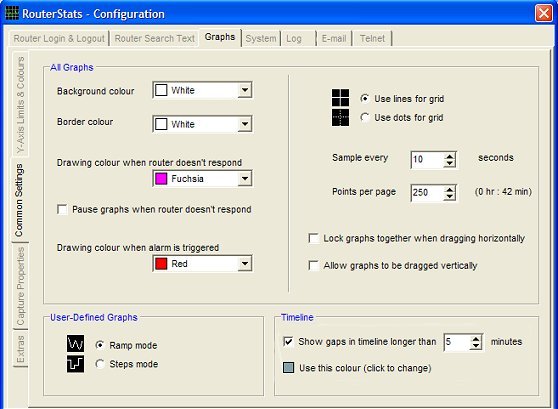
On the Common Settings page, you can change the background colour and grid 'style' of all three graphs.
You can select a different line-drawing colour when the router doesn't respond - or you can check the Pause graphs when router doesn't respond checkbox - and you can select a drawing colour for when an alarm has been triggered.
You can change the interval at which RouterStats interrogates the router - adjustable in 1-second increments. The maximum is 2 minutes; the minimum is 5 seconds although I would recommend 10 or 15 seconds as a more usual minimum as shorter intervals place a large burden on your LAN and on your computer's CPU.
You can also set the number of points plotted per page of the graph. The approximate time covered by each page is shown alongside the setting control .
If Lock graphs together when dragging is checked, dragging any graph horizontally will drag all graphs in unison. Alternatively, holding the Ctrl key while dragging will do the same. The graphs will automatically return to the current time when the next plot occurs so, if the interval between samples is short, it may be more convenient to temporarily press the Stop button while viewing 'historical' parts of the graph.
The User-defined Graphs can be set to display the plotted points such that there is either a sloping line (ramp mode) or a stepped line (steps mode) between each point.
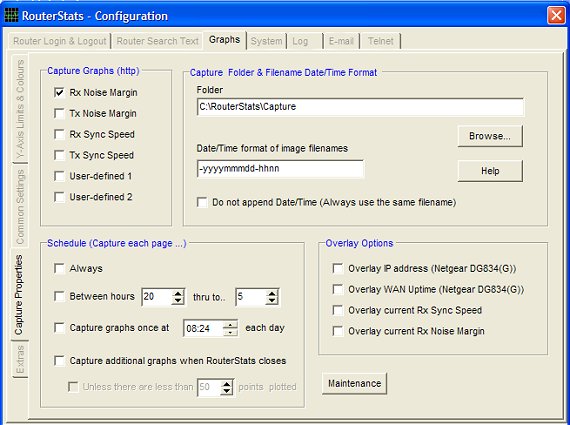
 In the Timeline section, check the Highlight gaps in timeline checkbox to draw a vertical
line on the six http graphs if the timeline is non-contiguous (For example, while the computer is hibernating the plotting will
stop).
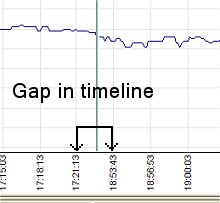
In the Timeline section, check the Highlight gaps in timeline checkbox to draw a vertical
line on the six http graphs if the timeline is non-contiguous (For example, while the computer is hibernating the plotting will
stop).
Gaps created "manually" by pressing the main Stop button will not be highlighted.
The telnet graphs do not highlight the gaps.
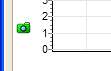 | This icon indicates the graph has been selected for capture but the time is outside the scheduled capture time. |
 | This icon indicates the graph has been selected for capture and the time is within the scheduled capture time (or the Always radio button is selected). |
 | This icon indicates the graph has been selected for capture and a time has been set for a daily 'one off ' capture. |
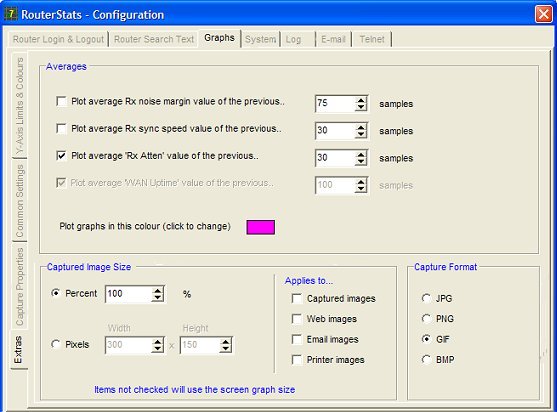
The Rx Noise Margin, Rx Sync and the two User-defined graphs can have their average values plotted.
The average values are "rolling values" of the previous 'n' samples, where 'n' can be adjusted with the edit boxes.
The plotting colour can be changed by clicking on the coloured box and selecting a new colour.
Normally, the size of the captured images is the same as the screen images but this can be changed here either as a percentage of the screen graph or by specifying an absolute width and height.
Use the checkboxes to specify which images will be resized.
Please note that there is a slight unavoidable flicker while resized images are captured. This might be objectionable if the Applies to Web images checkbox is checked because web images are captured every sample.
Note also that the text on the graphs is not resized so any values which are overlayed on the graphs (IP address, Rx Noise or Rx Sync) may not "fit" along the graph's top edge.
Graphs can be captured in JPG, PNG, GIF or BMP format. BMP's produce a very large file-size and can't be recommended. GIF's generally provide the smallest file-size.
The default format of Save As... will be the same as selected here but images can be saved in any format using Save As... from a graph's popup menu.
Once the graph configuration is completed, press the Close button to close the configuration window and return to the main RouterStats graphs window.
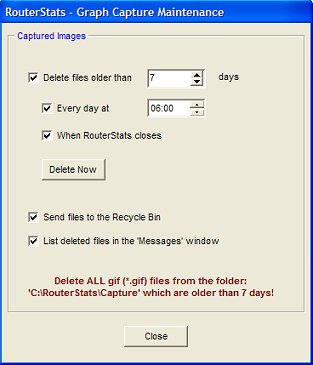 Set the number of days you want to keep the captured images for and set a
time when the maintenance will take place.
Set the number of days you want to keep the captured images for and set a
time when the maintenance will take place.