Temperature & Relative Humidity
Measuring temperature is probably the most straightforward of all the sensors. The entire family of PICAXE chips has two commands dedicated to one specific temperature sensor from Maxim - the DS18B20.The Honeywell HIH-3610 Humidity sensor provides a 0.8 - 3.9v analogue signal output for a 0% to 100% Relative Humidity.
NOTE: January 2025.
The HIH-4000 series humidity sensors only seem to be available at ridiculous prices from the main suppliers. I've used ones from AliExpress who have them for less than 10UK and they seem to work ok.
The original HIH-3610 has gone faulty - giving a permanent 4.95 volts output. Considering it cost 25, I was surprised that techsupplies.co.uk don't offer any sort of warranty but I found a replacement HIH-4000-001 (which replaces the specified HIH-3610 anyway) for just over 12 including postage from a company in Canada advertising on eBay (Or search eBay for HIH-4000-001).
[Update: January 2015]
I've had to replace the HIH-4000-001 sensor again.
While replacing it, I noticed that the copper tracks on the small PCB are blackened and starting to corrode. I intend to make new (identical) PCB but will take care to protect the
copper with silicone grease or cellulose spray.
[Update December 1st 2015]
Replaced the HIH-4000-001 sensor again (reading very low). Fitted new PCB as noted above but it's the sensor that goes faulty.
[Update May 06th 2018]
Replaced the HIH-4000-001 sensor again. Reading stuck at 100%.
[Update October 9th 2020]
Replaced the HIH-4000-001 sensor with an HIH-4000-003. They're available from AliExpress and Banggood at a reasonable price so I'll continue to use this sensor for now.
[Update January 12th 2025]
Replaced the HIH-4000-003 sensor again. They're available from AliExpress at a reasonable price so I'll continue to use this sensor
for now.
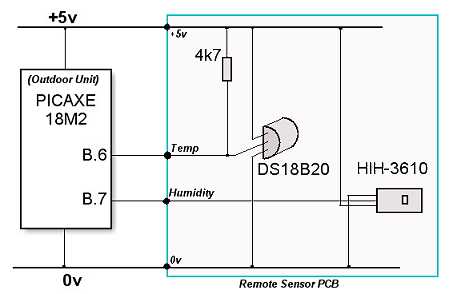 | 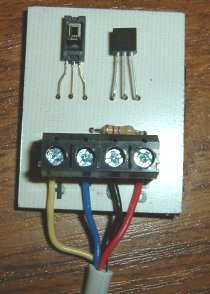 |
I mounted both sensors on a small PCB with the temperature sensor's 4k7 pullup resistor and a 4-way terminal block.
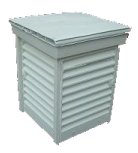 The PCB is fitted
inside a home-made Stevenson Screen; full constructional details can be found here.
The PCB is fitted
inside a home-made Stevenson Screen; full constructional details can be found here.
The DS18B20 temperature sensor uses a 1-wire digital signal. The HIH-3610 provides a 0 - 3.9v analogue signal. I've tested both with 3 metres of ordinary 4-core (house alarm) cable and both performed well.
The simplest code for each of the sensors is shown below. More precise code, which reads the values to one decimal place is shown on Peter Anderson's excellent site. Peter's code is used in the final version of my own weather station.
The temperature sensor provides ±0.5°C accuracy and the humidity sensor is accurate to within ±2% Relative Humidity so it's debatable how many decimal places it's worth displaying for these values! As they're usually dispalyed to one decimal place, this weather station follows the convention - which isn't to say that the figures are necessarily that accurate (My watch displays the time to the nearest second but it's usually a couple of minutes fast!).
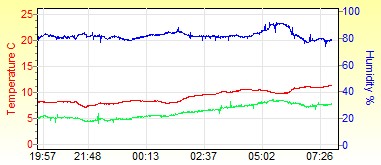 Example plot from the software running on the PC.
The green plot is the dewpoint,
derived from the temperature and relative humidity. (Calculating
dewpoint.)
Temperature
   main:
	  readtemp B.6, b1 		; read value into b1
	  if b1 > 127 then neg 		; test for negative
	  sertxd (#b1, cr, lf) 		; transmit value to PE terminal
	  pause 5000
	  goto main

   neg:
	  b1 = b1 - 128 		; adjust neg value
	  sertxt ( - ) 			; transmit negative symbol
	  sertxt (#b1, cr, lf)		; transmit value to PE terminal
	  pause 5000
          goto main
Relative Humidity
   main:
	  readadc B.7,b1 		; read humidity value
	  b1 = b1 - 41 * 100 / 157 	; change to %RH
 	  sertxd (#b1, "%", cr, lf)
	  pause 5000 			; wait 5 seconds
	  goto main
Humidity Sensor Maths
The following notes are taken from the Revolution Education Datasheet for the Honeywell HIH-3610. Picaxe maths definitely isn't one of my strong points so putting the information here is as much for my own convenience - and to help me understand - as anything else.
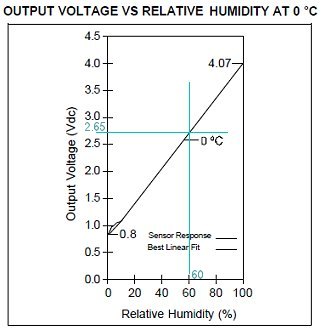 |
This graph, from the Honeywell datasheet, shows the response of a "typical" sensor at 0°C.
The voltage from the sensor is measured with the ADC input B.7 on our outdoor unit's main 18M2 Picaxe Microcontroller. In the code
shown above, the value, which is represented as a number between 0 and 255 (ie 256 steps), is stored in the variable b1.
Our circuit uses a regulated 5 volt supply, so each ADC step is:
The graph shows an offset of 0.8 volts which is an ADC value of:
Taking example values from the graph, the slope of the graph (taking the offset into account) is roughly :
The ADC steps per %RH is, therefore:
%RH = ADC reading ADC offset / (ADC steps per %RH), or
Multiplying top and bottom by 100 (because Picaxe maths can't do fractions), it becomes:
|