The PC Software
 Download
The software running on the PC was written using Borland Delphi 7 Enterprise. It's fairly rudimentary in its present form but does, at least, prove the Picaxe to PC communication. I'm describing it here simply for completeness - I imagine that something written in VBASIC would be just as straightforward.
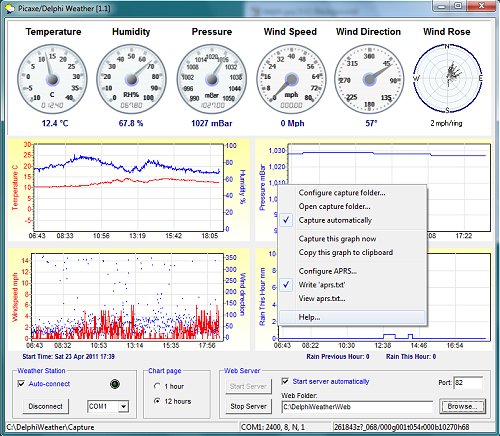
The graphs can be selected to display either 1 hour or 12 hours per "page". When the graphs have scrolled, they can be dragged back in time horizontally using the left mouse button. The Temperature, Pressure and Rain-Count graphs can also be dragged vertically if required. I intend to add an auto-adjust feature at some time.
Capturing Graphs Right-click on any graph for its popup context menu. Here you can set or change a "Capture Folder" - each full page of the graphs will be saved automatically as a JPG image if the Capture automatically menu item is checked. The filename will be the graph's left-axis title with spaces changed to the underscore character. Graphs can be captured or copied to the clipboard at any time by clicking the appropriate menu item. Note: 'Capture folder' and 'Capture automatically' apply to all graphs. 'Capture now' and 'Copy to clipboard' apply to individual graphs.
APRS Data
It's possible to configure a limited set of APRS data which is written once a minute to a one-line file APRS.TXT and which is saved in the same folder as Weather.exe.Example:
G4VWL>APRS:@19194122z5340.40N/03110.00W_009/000g...t044r000b10310h82
Note that the temperature is in degrees Farenheit and the rainfall is in 1/100ths of an inch. Although the pressure is printed to 5 digits, the reading falls outside the official APRS specification which calls for a 0.1 mBar resolution.
The Web Server
IF I have my own weather station server running, you can see a Demo display here.To run the optional web server, a folder is selected for the web page using the "Browse.." button. JPG images of the gauges and the graphs will be created in the same folder. The images are created whether the Server is running or not. This allows the images to be used with an external server, if desired.
The in-built server can only serve pages with an .htm or .html or .txt extension; or it can serve the .jpg image files without a webpage (for inclusion in other webpages). It cannot handle "server-side" features, such as php.
The page is accessed in a remote web browser with the URL - http://{your-internet-ip}:82/{filename.htm}
The webserver port number (default 82) can be changed in the edit box. You'll need to set up "port forwarding" in your internet router so as to give visitors access to the webpage. And, you'll need to tell Windows Firewall to Allow the server when it asks. Below is a demonstration webpage in which the images automatically update smoothly (ie, without a full page refresh) every 30 seconds:
weather.htm
<!DOCTYPE HTML PUBLIC "-//W3C//DTD HTML 4.01 Transitional//EN"
            "http://www.w3.org/TR/html4/loose.dtd">
<html>
<head>
  <title>Picaxe Weather Graphs</title>
  <meta http-equiv="Content-Type" content="text/html; charset=iso-8859-1">

<script type="text/javascript">
 function clock() {
    var d = new Date();
    var s = d.toGMTString();
    document.getElementById('clk').innerHTML="These graphs should update every 30 seconds (" +   s +")";
 }
</script>

<script type="text/javascript">
  var t = 30;
  var max = 0;
  var maxlimit = 12;

  var pict = new Array(2);
  pict[0] = new Image();
  pict[1] = new Image();
  pict[2] = new Image();
  pict[3] = new Image();
  pict[4] = new Image();
  preload();

function preload() {
  var now = new Date();

  pict[0].src = 'temperature.jpg?' + now.getTime();
  pict[1].src = 'humidity.jpg?' + now.getTime();
  pict[2].src = 'pressure.jpg?' + now.getTime();
  pict[3].src = 'pressure-gauge.jpg?' + now.getTime();
  pict[4].src = 'wind-dir.jpg?' + now.getTime();
}

function update () {
  max = max + 1;
  if (max >= maxlimit) {
    return;
  }
  preload();

  document.images['pic0'].src = pict[0].src;
  document.images['pic1'].src = pict[1].src;
  document.images['pic2'].src = pict[2].src;
  document.images['pic3'].src = pict[3].src;
  document.images['pic4'].src = pict[4].src;
}

function inner() {
  var d = new Date();
  var s = d.toGMTString();
  if (max < maxlimit) {
    document.getElementById('clk').innerHTML=" " + s +
          ".  This image should update in " + t + " seconds. ";
  } else {
    document.getElementById('clk').innerHTML=" " + s;
  }
}

function clock(){
  t = t-1;
  if (t=='00'){t=30; update();}
  if (t < 10) t = '0' + t;
  inner();
}
</script>

</head>
<body   OnLoad="setInterval('clock()',1000)">
<center><font color="blue"><h2>Picaxe Weather Station - Server Demo>/font<</h2></center>

<div id="clk"></div>

<p>

<img src="temperature.jpg" alt="" name="pic0">
<img src="humidity.jpg" alt="" name="pic1"> <p>

<img src="pressure-gauge.jpg" alt="" name="pic3">
<img src="pressure.jpg" alt="" name="pic2">
<img src="wind-dir.jpg" alt="" name="pic4">

</body>
</html>