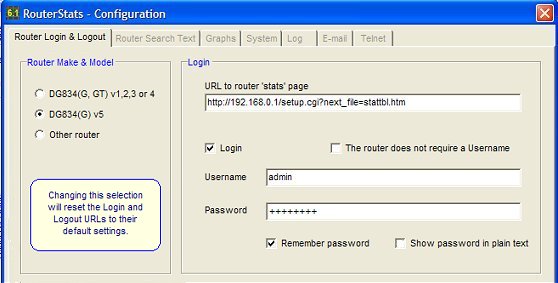
In the Router Make & Model section, select the radio button appropriate for your router.
In the Login section, enter the URL you discovered previously in 'Finding the URL'. If you're using a Netgear DG834 or DG834G, the URL should already be there for you unless you've changed the IP address from the default (192.168.0.1).
If you need to log in to your router, check the Login checkbox and enter your username and password.
If you're using a Netgear DG834 series router, you can skip the rest of the configuration and jump to configuring the graphs.
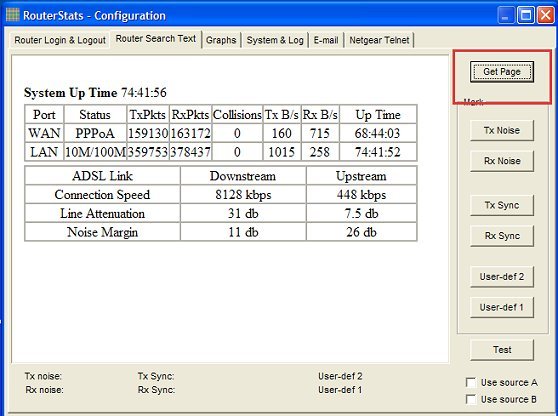
You may need to press the Get Page button a couple of times but, with luck, the router's stats page should be displayed in the window.
If the page is displayed but the numeric values are missing, see the section below ( The Use Source A and Use Source B Checkboxes )
If you have problems getting the page to display at all, check out the problems page here.
If you have selected a Netgear DG834 series router, you can jump to Step 4.
For other routers, or if you want to set up 'User-defined' values with the DG834, move to Step 3.
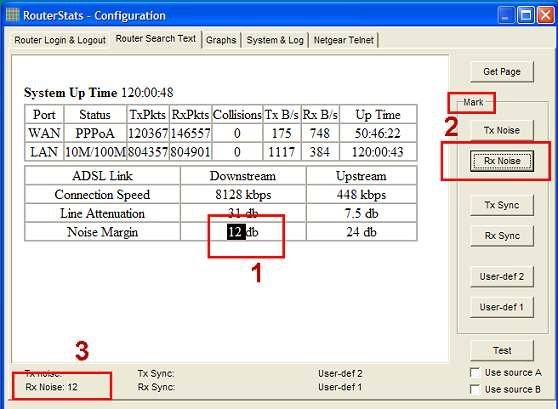
Find where it is displayed in the window and highlight the figure (1). Press the Rx Noise button (2) in order to mark its position. Its value should appear next to the 'Rx Noise' text below the window (3).
If you check the Use source A or Use source B checkbox, the router source
code 'behind' the HTML display will
be shown in RouterStats instead of the HTML display. If the numeric values of the stats are
shown in the source code, you can try using those in Steps 2 and 3.
If you change from one source to the other, you will need to re-mark the text (Steps 2 and 3).
See The FAQ - Q4 for more details.
If all has gone well, you can now mark the Rx Sync Speed in a similar way - marking its value
in the top window, then pressing the Rx Sync button to mark its position.
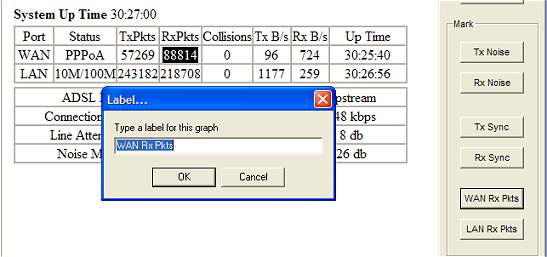
RouterStats also has two user-defined graphs which are 'marked' in the same way as
above.
When marking for either user-defined graph, you will be prompted to type a suitable label which
will appear on the graphs.
The two radio buttons allow you to select whether RouterStats will plot the value directly as extracted
from the stats page or whether it will plot the difference between successive samples. This allows
the graph to plot a "value per sample" instead of a simple cumulative value provided by the router.
For example, if you were monitoring the Line Attenuation, you would select Plot value directly to grap.
If you were monitoring 'Received LAN Packets', it would be more useful to select Plot difference between
successive values to monitor the received LAN packets per sample.
You can switch between the two plotting methods at any time using 'Radio Button' items on the User-defined
graphs' popup menu.
The value shown on the Toolbar will always be the "raw" value directly from the router.
See also: FAQ - Marking the Text
The next step is to configure the graphs.
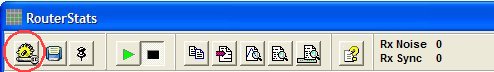
RouterStats will automatically save your configuration settings when it closes but you can save
the settings at any time by clicking the Apply & Save button on the Configuration Window's bottom panel.
The Use Source A and Use Source B Checkboxes
Some routers use JavaScript to display the statistics which is difficult for RouterStats to
resolve. Sometimes the JavaScript is on the same page as the HTML which provides the display,
sometimes it is on a separate page.Step 4
Finally, press the Test button. This simulates a "live" retrieval of
the Noise Margin figure from the router.